Last year President Obama announced a new biomedical initiative, aimed at understanding the human mind and cunningly acronymed to “BRAIN”. In the recently proposed FY2015 budget, $200 million is allocated for the project, double the $100 million in FY2014.
Certainly, this sounds like a big-ticket item, but this has been met by some skepticism from scientists. So, how big is this initiative, really?
The biomedical funding landscape
The federal government is the backbone of biomedical research in the US, and some have estimated the government as providing ~65% of all academic (biomedical) funds. The vast majority of that money comes from the National Institutes of Health (NIH), whose budget in 2014 totaled $30.1 billion. The next largest federal funders, the Department of Defense and the National Science Foundation, are a distant second and third, coming in with $2.4 and $2.1 billion budgets, respectively.
The late 1990s and early 2000s are often seen as the glory years for the NIH, with the budget more than doubling between 1997 and 2007. But the crash of 2008 reorganized the budgetary landscape, and there have been no substantial increases in the NIH budget since then, not even to keep pace with inflation. The budgetary tightening, in turn, has led to worsening conditions for researchers by nearly every metric available—the number of grants awarded, the success rate for applications, and the award size.
The National Institutes of Health
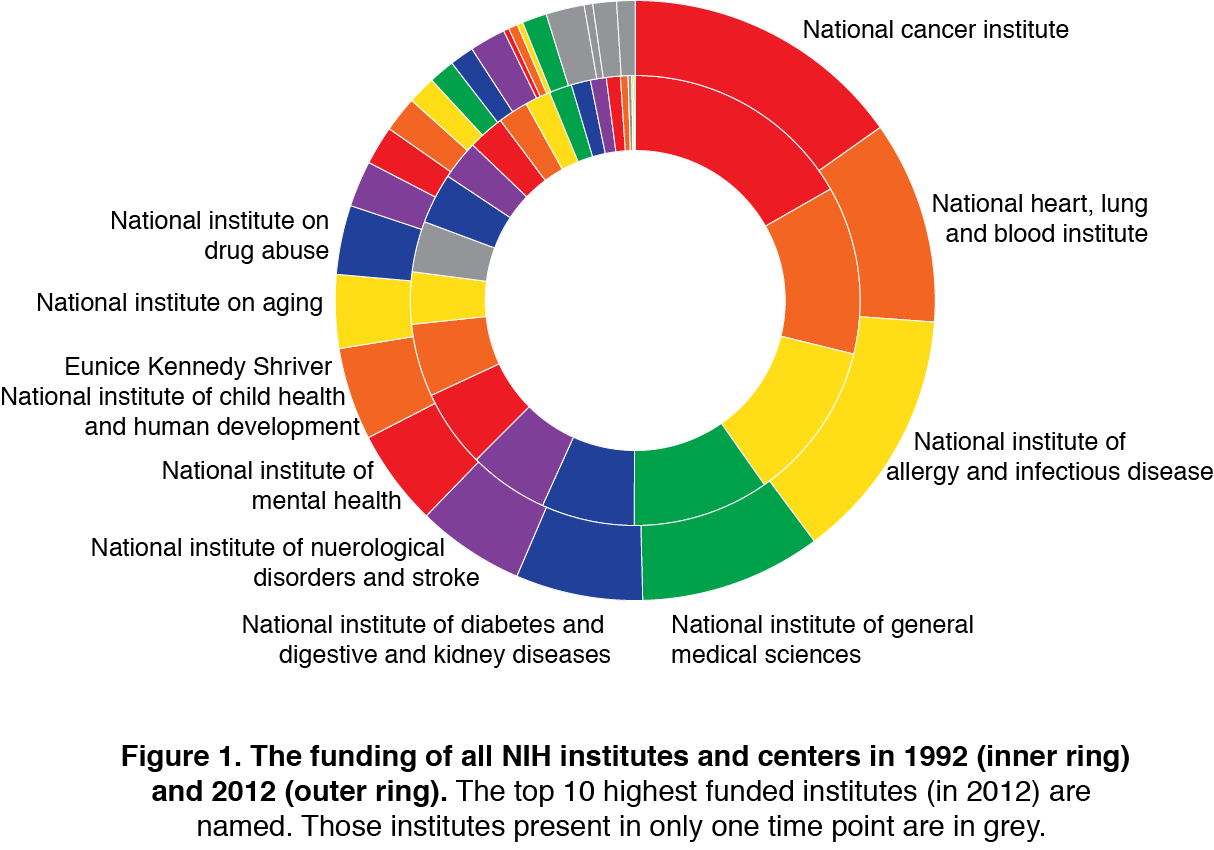
Let’s consider the federal behemoth that is the NIH more carefully. The NIH is divided into 27 institutes and centers, each with their own research agenda, such as the National Cancer Institute (NCI), which focuses on cancer prevention and treatment. Each institute then awards extramural grants across the country and also fund intramural research activities (which represent about $4.8 billion or 16% of the total budget).
Click image to view full size
Remarkably, despite scientific advances, budgetary changes (e.g. growth in the late 1990s, stagnation since the late 2000s), and the creation of new institutes within the NIH, allocation between the various institutes is relatively unchanged over the past twenty years with the biggest kid on the block being the NCI, closely followed by the National Institute of Allergy and Infectious Disease (Figure 1). With a total budget of $3.6 billion, the NCI received 15.2% of the total NIH budget in 2012. Not surprisingly, cancer represents one of the major NIH funding areas: an estimated $5.6 billion were spent overall on cancer research in 2012.
The Big State Players: California and Massachusetts*
Click image to view full size
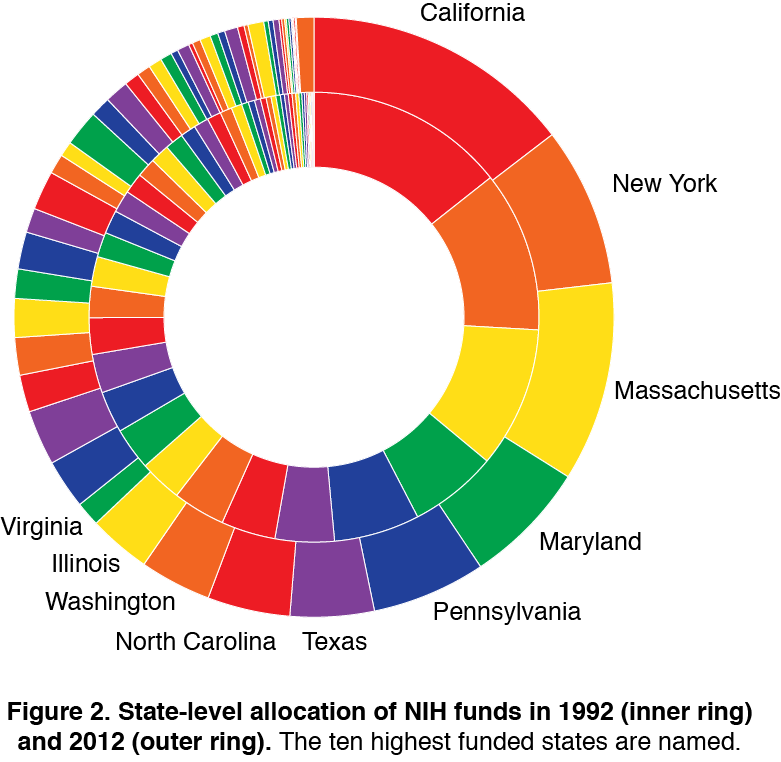
Funding at the state level has also remained remarkably consistent. The five most funded states in 1992? California, New York, Massachusetts, Maryland and Pennsylvania. The five most funded states in 2012? California, Massachusetts, New York, Maryland and Pennsylvania. What’s even more astonishing is that funding to these states represented close to 50% of the total NIH budget in 1992—and in 2012 (Figure 2).
Of course, it’s not terribly surprising that California, a state of 38 million people and a $2-trillion state GDP, would claim top spot. But Massachusetts, a much smaller state, comes in second with $2.3 billion in NIH awards.

Click image to view full size
So what happens if funding is calculated a percent of state GDP? Now a different picture emerges (Figure 3). Once GDP is taken into account, the top performing state, by a significant margin, is Massachusetts, with Maryland, Rhode Island, North Carolina and Vermont rounding out the top five. California looks less impressive with this normalized view: even with its $3.6 billion dollar NIH funds, it now comes in at number 11.
The Top 40 Medical Research Institutions
Naturally, statewide performances reflect the performances of various academic institutions. Funding at this level has seen very little fluctuation over the past twenty years. Of the those institutions in the top 40 in 2012, all but 7 were in the top 40 in 1992, and only two (Oregon Health & Sciences University and Northwestern University) were outside the top 50.
The sheer amount of NIH money awarded to these institutions is striking, and some individual ones actually drive the total funding going to their state:
- In North Carolina, the heavy hitters are University of North Carolina-Chapel Hill and Duke University. Together, these institutions pulled in $0.7 billion of North Carolina’s $1.1 billion total.
- In Maryland, Johns Hopkins is the largest force, garnering $645 million in 2012 (or 47% of the total $1.3 billion). In fact, Johns Hopkins is the best-funded institution in the nation, both in 1992 and 2012.
- The UC system received $1.8 billion from the NIH in 2012, which amounts to 50% of California’s total NIH funds.
Despite an increase in the number of institutions funded by the NIH between 1992 and 2012, the top 40 institutions received ~50% of the total extramural budget both in 1992 and in 2012. Of course, one consequence is that the average funding, as a percentage, for the other institutions has decreased over the past twenty years.
The BRAIN Initiative
In light of these numbers, let’s go back to that $200-million allocation for the BRAIN initiative, half of which will come from the NIH. Although in relation to average household budget, $100 million clearly represents a nearly inconceivable sum of money, this is a paltry amount by NIH standards, only 0.3% of the total budget—this budget would be only the tiniest of slivers in Figure 1, larger than only two of 27 NIH’s institutes.
To put this another way: if all of the $100 million went to a single state, this state would be ranked 35th, just ahead of New Hampshire and Kansas. If all of the money went to only a single institution, by the 2012 rankings, this institution would come in at number 65.
But, some might argue, the power of initiatives comes from targeting the money to specific biomedical problems. Unfortunately, even compared with other analogous biomedical initiatives, $100 million for the BRAIN initiative doesn’t fare well. The Human Genome Project is thought to have cost 3 billion dollars over 10 years—low estimates put this at $360-400 million per year (in 2014 dollars). Similarly, in Texas, a recent legislative cancer initiative called CPRIT has $3 billion to spend on cancer research over the next ten years—in other words, ~$300 million dollars per year. Remember, that’s just in Texas. And the relative impact here is likely to be much larger than even that might suggest since the amount NIH awarded to Texan scientists in 2012 was $1.1 billion—CPRIT thus represents around a 25% increase over these levels. In contrast, an estimated $5.6 billion funded neuroscience research in 2012: $0.1 billion represents a mere 1.7% of that budget.
Will the BRAIN initiative work? It’s hard to say, but most scientists would probably respond with something like, “well, it’s a good down payment, but we need to do more.”
*Interestingly, since I wrote the initial draft of this article (mid-March), there have been reports on how some Congress members are now taking issue with the discrepancies in the amount of NIH funds allocated to different states.

Pingback: A Scientist’s Behind-the-Scenes Look at FiveThirtyEight | How to Be a Scientist
Pingback: Numbers are important. So is scale. | How to Be a Scientist